Pythagorean Expectation for Sports Predictions

Introduction
Recently, I read Moneyball by Michael Lewis, a story that brilliantly captures how data revolutionized baseball. Many of the chapters mentioned Bill James, a statistician who revolutionized baseball analytics since 1977. The book explained that the Moneyball philosophy is the idea that traditional statistics often overlook deeper truths in performance, and that undervalued indicators can reveal winning patterns. This is where Bill James came in to play in his creation of the Pythagorean Expectation.
The Pythagorean Expectation estimates a team’s expected winning percentage based not on wins or standings, but on their scoring efficiency. How many times they score compared to how many times they get scored on. Though originally created for baseball, this has been put into play in other sports, and I wanted to test it out for myself with real life scoring data. How would different sports styles affect the formulas effectiveness?
This led to the development of Pythagorean-Expectation-Sports-Predictions, a Python-based project exploring how well the formula predicts win percentages across five major leagues:
- Major League Baseball (MLB)
- National Basketball Association (NBA)
- National Hockey League (NHL)
- Indian Premier League (IPL – T20 Cricket)
- English Soccer (Premier League, Championship, League One, League Two)
Background
The Pythagorean Expectation formula estimates a team's winning percentage as:
Win% = (Score For)² / ((Score For)² + (Score Against)²)
- Score For and Score Against are total season scores.
- The model assumes scoring margin is a more stable performance indicator than raw win-loss records.
Methodology
Each Jupyter Notebook in the project includes:
- Data Retrieval: Historical data from publicly available Excel datasets.
- Feature Engineering: Calculated total points/runs/goals for and against.
- Model Implementation: Applied the Pythagorean formula for prediction.
- Analysis: Compared predicted vs. actual win % using regression.
- Visualization: Plotted scatter graphs to assess fit.
Full code available on GitHub.
Results Overview
Pythagorean Expectation
NHL
- Coefficient: 1.076
- For every 0.1 unit increase in Pythagorean, winning percentage increases by 0.1076
- R-squared: 0.902
- Pythagorean accounts for 90.2% of the variation in winning percentage.
- P-Value: 0.000
- P-value < 0.05 — result is statistically significant.
- Conclusion: NHL shows strong correlation with Pythagorean Expectation. Scoring differential leads to wins in a clear, predictable way.

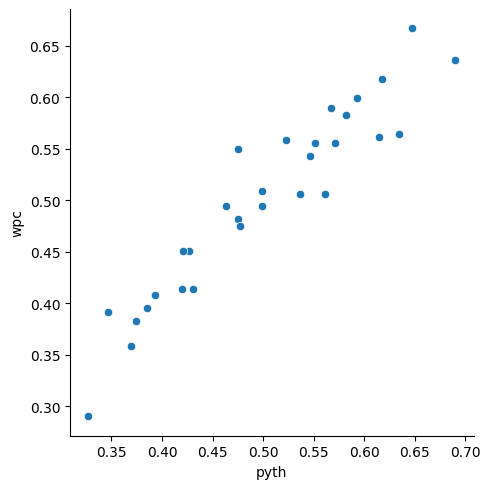
MLB
- Coefficient: 0.877
- For every 0.1 unit increase in Pythagorean, winning percentage increases by 0.0887
- R-squared: 0.894
- Pythagorean accounts for 89.4% of the variation in winning percentage.
- P-Value: 0.000
- P-value < 0.05 — result is statistically significant.
- Conclusion: Strong model fit. MLB results align closely with Pythagorean predictions.
IPL
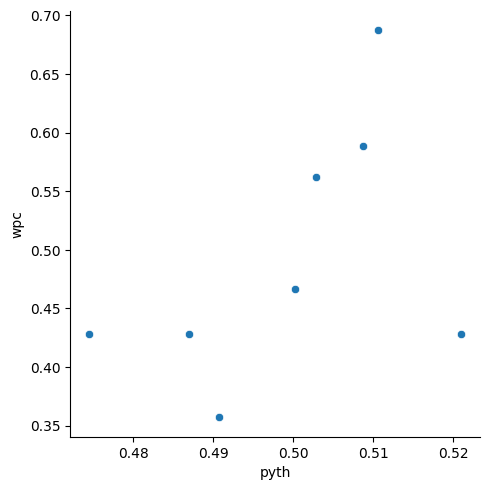
- Coefficient: 3.552
- For every 0.1 unit increase in Pythagorean, winning percentage increases by 0.3552
- R-squared: 0.234
- Pythagorean accounts for 23.4% of the variation in winning percentage.
- P-Value: 0.225
- P-value > 0.05 — not statistically significant.
- Conclusion: Pythagorean less effective in IPL. Format allows chasing team to win by only 1 run, limiting predictive power of run differentials.
NBA
- Coefficient: 6.554
- For every 0.1 unit increase in Pythagorean, winning percentage increases by 0.6554
- R-squared: 0.943
- Pythagorean accounts for 94.3% of the variation in winning percentage.
- P-Value: 0.000
- P-value < 0.05 — result is statistically significant.
- Conclusion: Excellent fit. High-scoring nature of basketball makes Pythagorean particularly effective.

English Soccer (4 Leagues)
- Coefficient: 0.6502
- For every 0.1 unit increase in Pythagorean, winning percentage increases by 0.06502
- R-squared: 0.934
- Pythagorean accounts for 93.4% of the variation in winning percentage.
- P-Value: 0.000
- P-value < 0.05 — result is statistically significant.
- Conclusion: Strong result even in low-scoring sport. Predictive strength holds in soccer formats.

Pythagorean Expectation for Predicting Winning Percentage
MLB
- Explanation: First-half data (pre All-Star break) was used to calculate Pythagorean Expectation. This was then used to predict second-half win percentage.
- Correlation Coefficients:
- Pythagorean → 2nd half win %: 0.69
- 1st half win % → 2nd half win %: 0.65
- Conclusion: Pythagorean better predicted second-half performance than first-half win %.

English Soccer
- Explanation: 2017 season data (goals scored and conceded) was used to compute Pythagorean, which then predicted 2018 win percentages.
- Correlation Coefficients:
- 2017 Pythagorean → 2018 win %: 0.616
- 2017 win % → 2018 win %: 0.602
- Conclusion: Pythagorean slightly outperformed win percentage as a predictor across seasons.

Takeaways and Conclusions
In exploring the Pythagorean Expectation across five distinct sports, this project reinforces how a simple statistical model originally conceived for baseball can reveal deeper patterns of team performance across different scoring systems and formats. The model performed best in four out of five sports, with cricket being the outlier, likely due to its unique structure where only one team bats at a time and the second team only needs to surpass the opponent’s score.
Compared to today’s machine learning algorithms, the Pythagorean Expectation is a simpler, lower-compute approach, yet it demonstrated strong performance. As sports continue to embrace data-driven decision-making, tools like the Pythagorean Expectation offer both accessibility and analytical depth, making them a crucial part of the modern sports analyst's toolkit.